


In the past two weeks we added to our Nonfiction Text Features hunt by identifying captions, labels, tables, and graphs in our texts. Here is a current pic of our anchor chart with all of the updated features:


Here’s a close-up of the pages attached to the chart. Each of these pages matches the ones the kids are putting into their scrapbooks.

Second graders often get captions and labels mixed up because both features are found near photographs and illustrations. Here is how I try to distinguish between the two for my students:
Captions
tell what a photograph or illustration is showing
Labels
help identify the different parts of a photograph or illustration
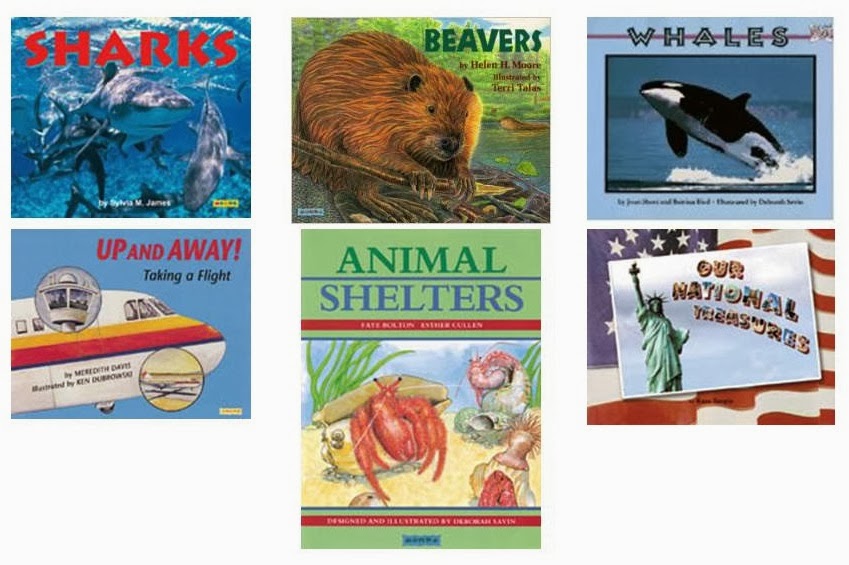
We used several books from our reading series to help us practice identifying the two during reading:
 As for tables and graphs, our district decided to pilot enVision Math, Common Core edition last October. By the time we got materials and training, it was November. Not only did we get a late start, but when we started pacing out the lessons we figured out we would not get to teach several of the topics. We have tried to be creative in addressing them through our Daily Math Review and pre-teaching some of the materials now. All of the measurement standards are not addressed until the very last topic. Luckily, we have been working on time and money since the first month of school.
We have been working on graphing for two weeks now and then will dive into measurement. Not only are we using some of the curriculum materials, but we are also supplementing with graphing materials from Super Teacher Worksheets. The kids are getting really good at reading & creating pictographs and answering questions. This class is better than most of my previous classes at answering questions like, “How many more apples did Carl have than James?” Since we are working on graphing, it was the PERFECT time to add tables and graphs to our nonfiction text features study.
I’ll post again next week to let you know which nonfiction text features we are learning about next. In the meantime, don’t forget that you have a few more days to try to win a $10 TpT gift certificate. Click here to read more about it.


One Response
We currently have Envision – the common core edition for second grade. How are you liking the pilot? Our district doesn't like it and will be piloting something else next year, I think.
What I Have Learned