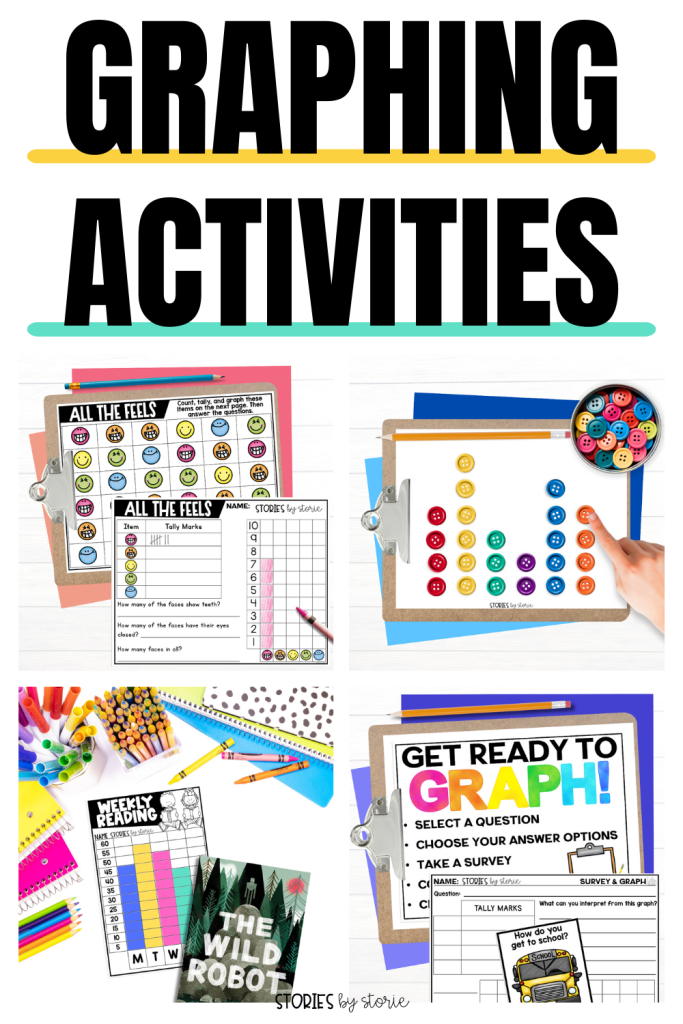
Are you getting ready to start your graphing unit? Let me help! I’m sharing my favorite graphing activities. This includes books, hands-on activities, and easy ways to get kids learning to read, interpret, and create a variety of graphs.
Graphing Activities
Teaching graphing helps lay the foundation for critical thinking and data analysis. By learning to create and interpret graphs, students develop the ability to organize information, recognize patterns, and draw conclusions based on evidence.
I’m sharing some of my favorite ideas and activities for you to try during your graphing unit!
Read About It
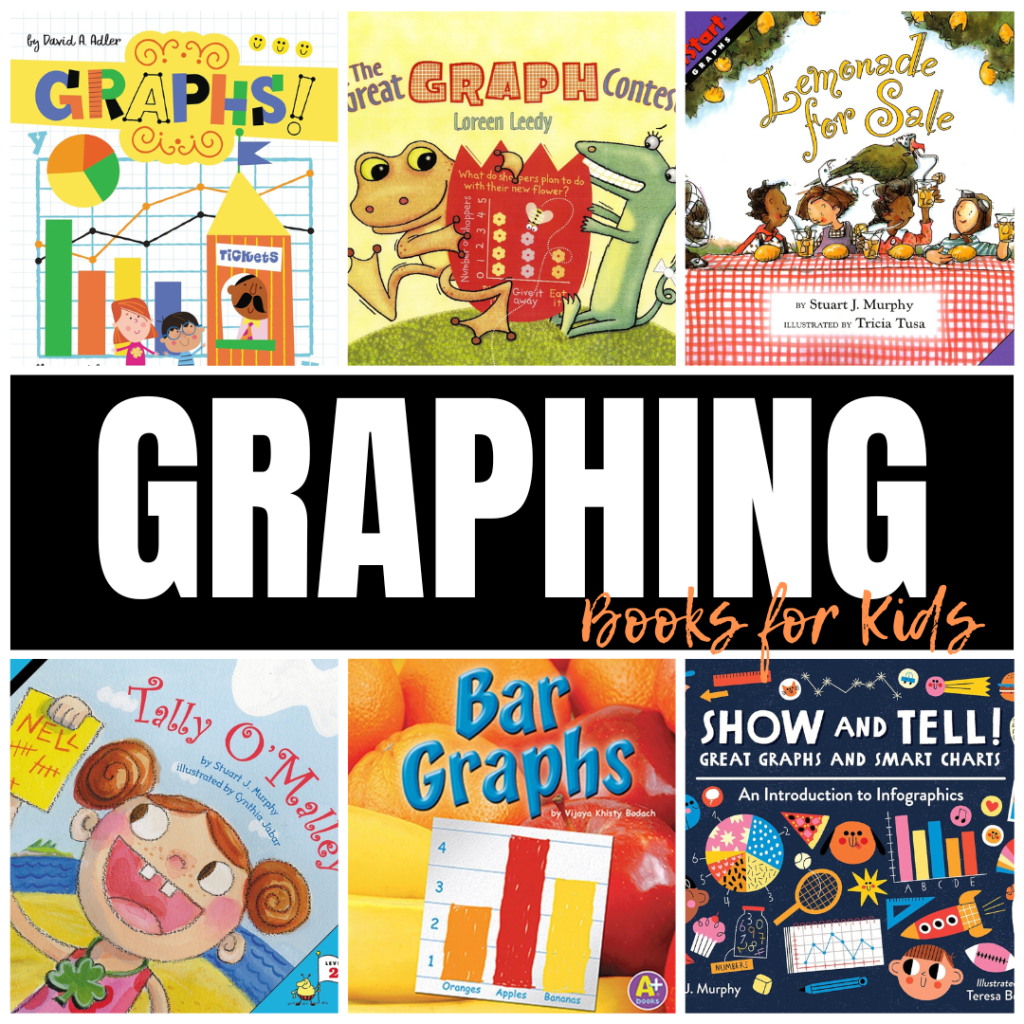
A great way to help build background knowledge on graphing is with books. These can be read before, during, or after your lessons. Here are some of my favorite books:
- The Great Graph Contest by Loreen Leedy
- Graphs! by David A. Adler
- Show and Tell! Great Graphs and Smart Charts by Stuart J. Murphy
- Lemonade for Sale by Stuart J. Murphy
- Tally O’Malley by Stuart J. Murphy
- The Best Vacation Ever by Stuart J. Murphy
- Tally Cat Keeps Track by Trudy Harris
- Graphing Story Problems by Lisa Colozza Cocca
- Family Reunion by Bonnie Bader
- Bar Graphs by Vijaya Bodach
- Math It! Graph It! by Nadia Higgins
- Tiger Math: Learning to Graph From a Baby Tiger by Ann Whitehead Nagda and Cindy Bickel
- Lines, Bars, and Circles: How William Playfair Invented Graphs by Helaine Becker
- How Do You Turn Data Into Drawings? by Clayton Tobias Grider
- Yumbo Gumbo by Keila V. Dawson
I found many of these books in my local library, but they are also available on Amazon. I suggest reading through the descriptions to determine which books would be most helpful for your graphing unit.
we are a participant in the amazon services llc associates program, an affiliate advertising program designed to provide a means for us to earn fees by linking to amazon.com and affiliated sites.
Build Vocabulary
Pre-teaching vocabulary can also be a helpful strategy before starting a new math unit. Not only does it build confidence and enhance understanding, but it’s an easy way to support differentiated instruction and make math more accessible to all learners.
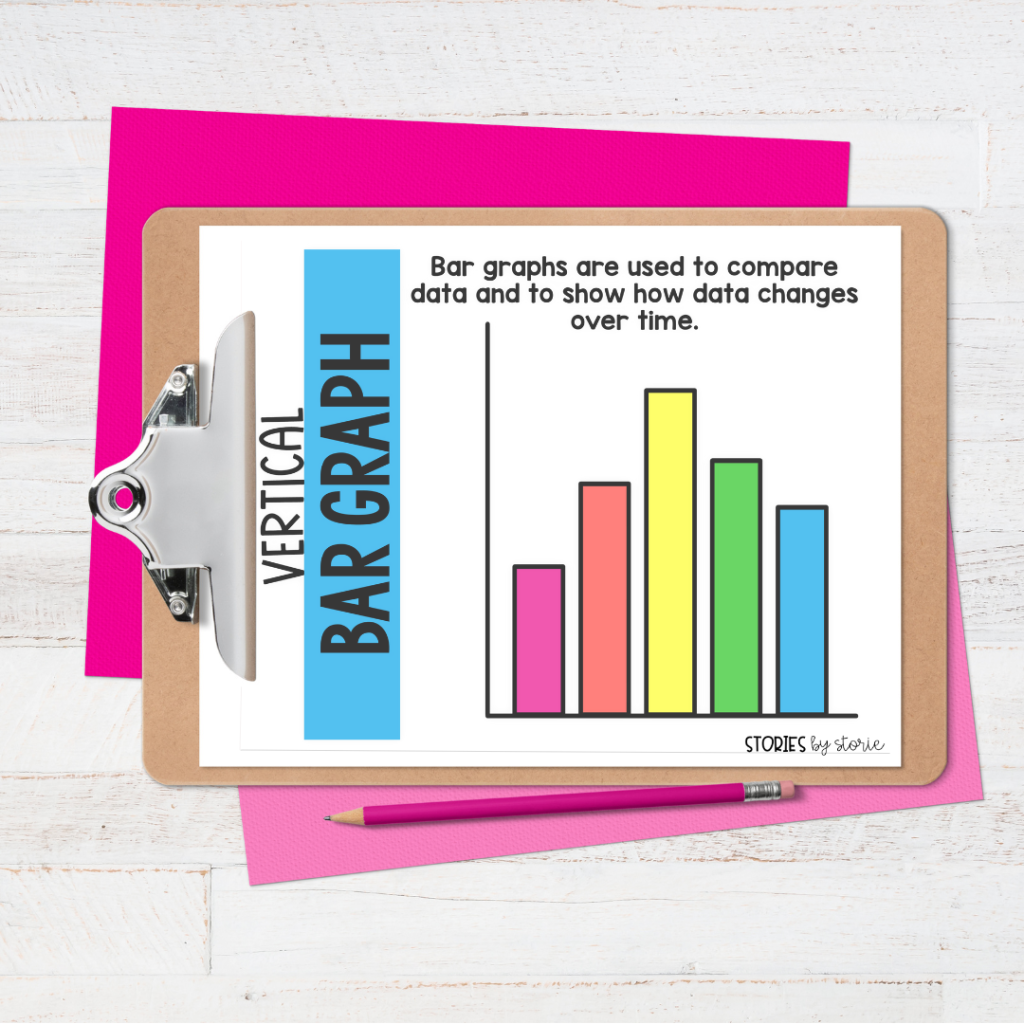
Because graphing relies heavily on visuals, having different types of graphs on display is vital when jumping back and forth between different ways to display data.
Use Sticky Notes
This is one of my favorite tools to use during graphing because of their versatility. After students put their name on a sticky note, they can place the note directly onto a class-made graph on the whiteboard. This works really well for bar graphs and line plots because it provides a clear, visual representation of the data. Using sticky notes in this way encourages collaboration, captures student attention, and increases engagement.
Because sticky notes can be easily moved, it’s one of my favorite ways to show students how to find the median for a given set of data. Plus, it’s an easy way to correct mistakes or manipulate the data to show different results.
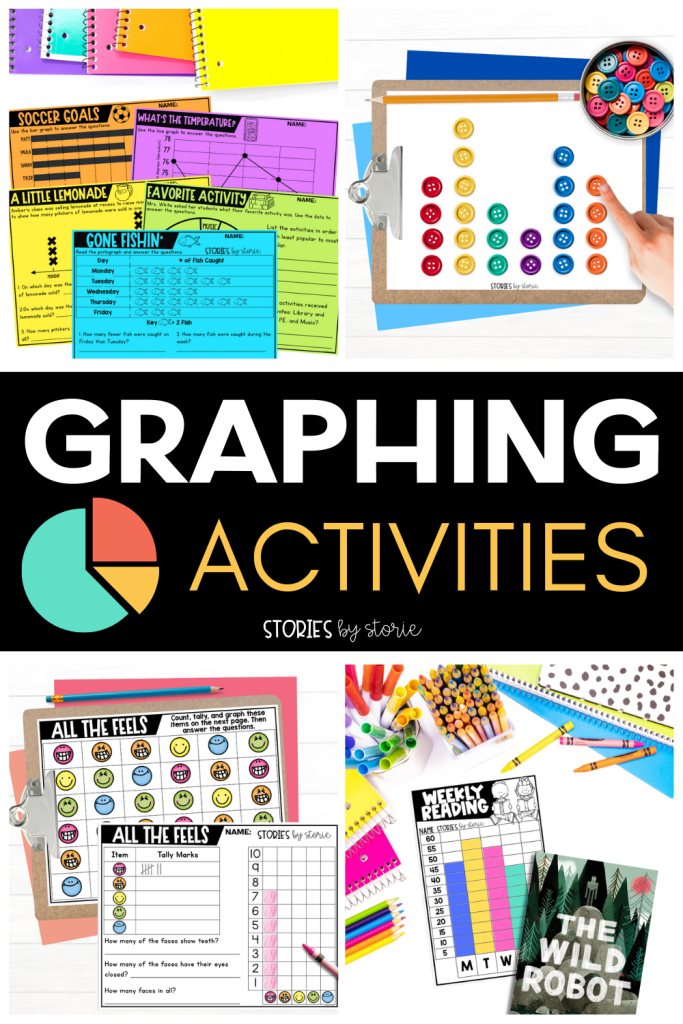
Hands-On Practice
Once you have introduced the vocabulary and have worked together to make graphs, it’s time to let students practice on their own. Here are a few of my favorite activities for hands-on practice.
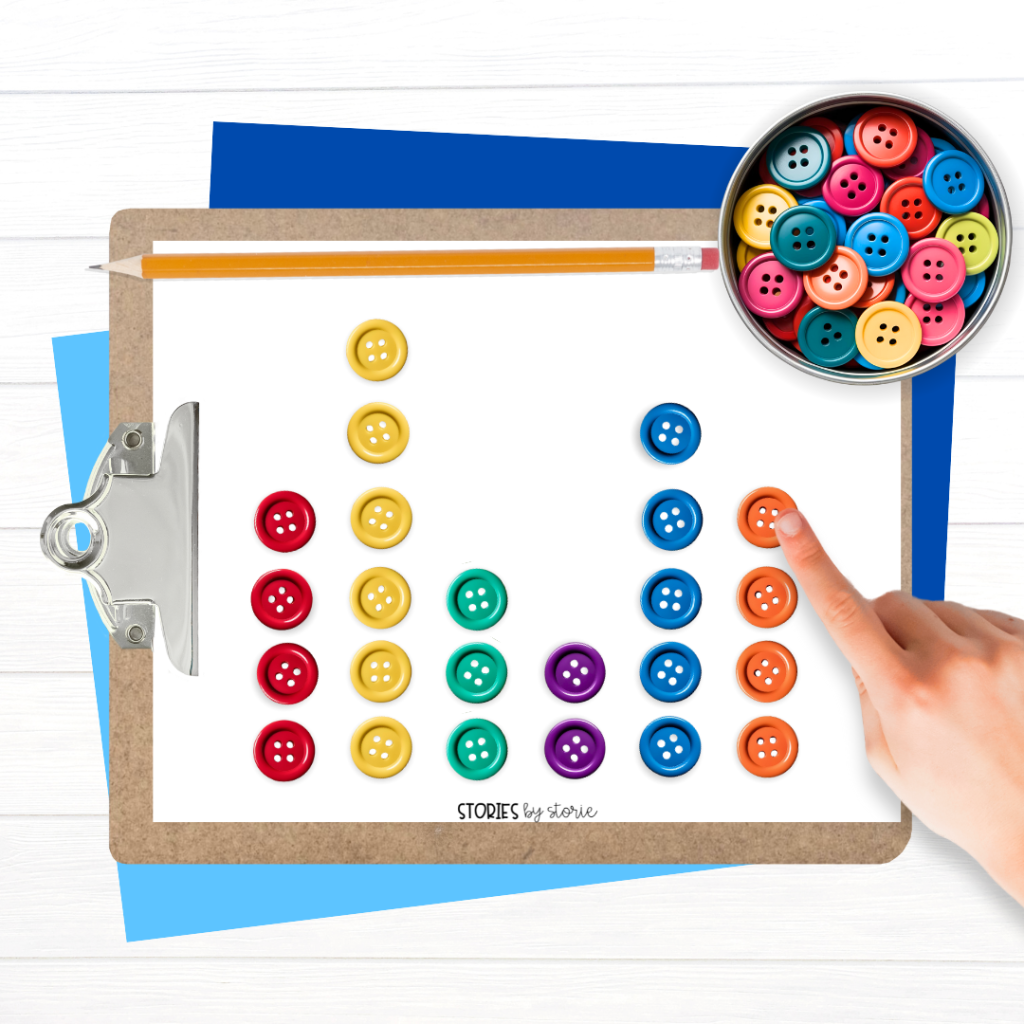
Scoop, Sort, and Graph
Place a variety of baggies or containers with objects at a Scoop, Sort, and Graph station. After choosing a set of items, students will scoop out a handful and place the objects onto a blank piece of paper. From there, students will sort the items and create a graph on the paper.
Here are some items you can use:
- mini erasers
- coins
- Unifix cubes
- buttons
- paper clips
- Lego or building blocks
- beads
- pom-poms
If you need a way to informally assess their work, have students take a photo of their completed graph using a school-issued Chromebook, iPad, etc.
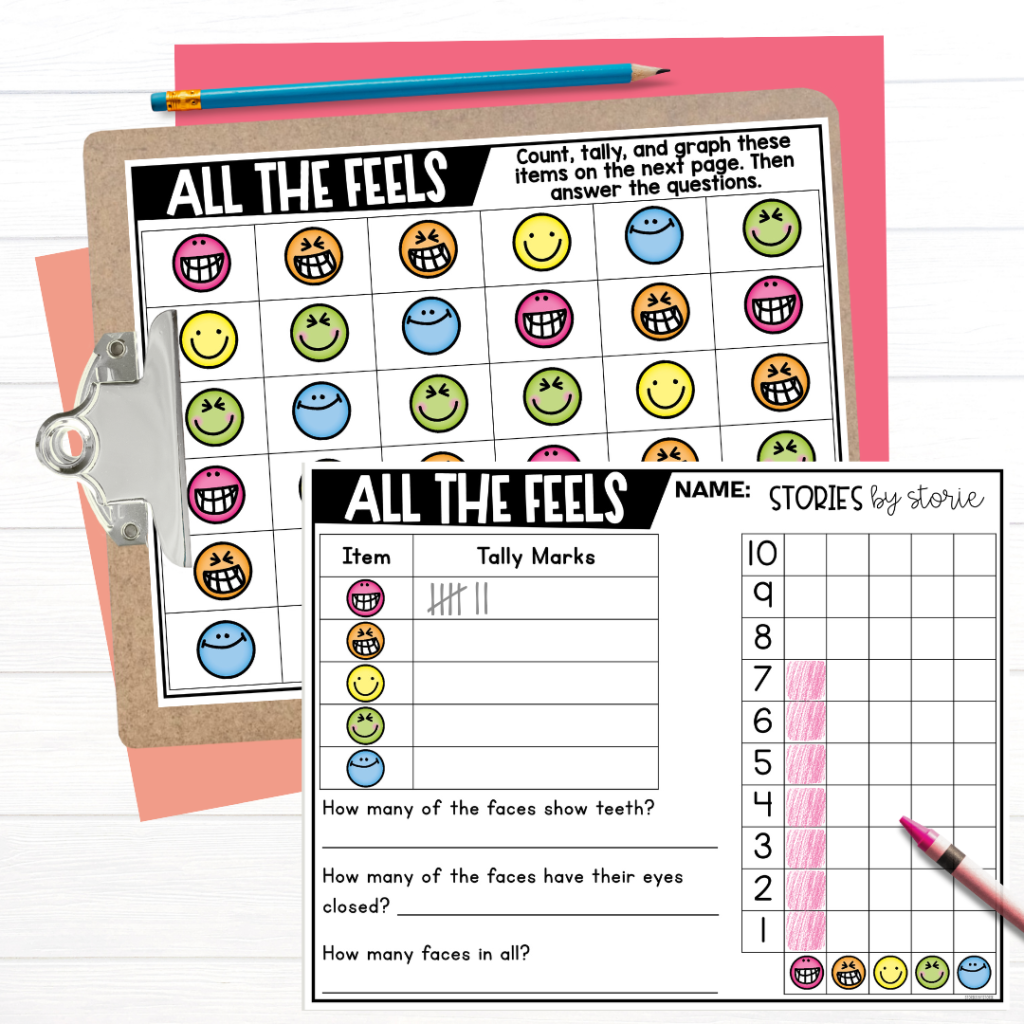
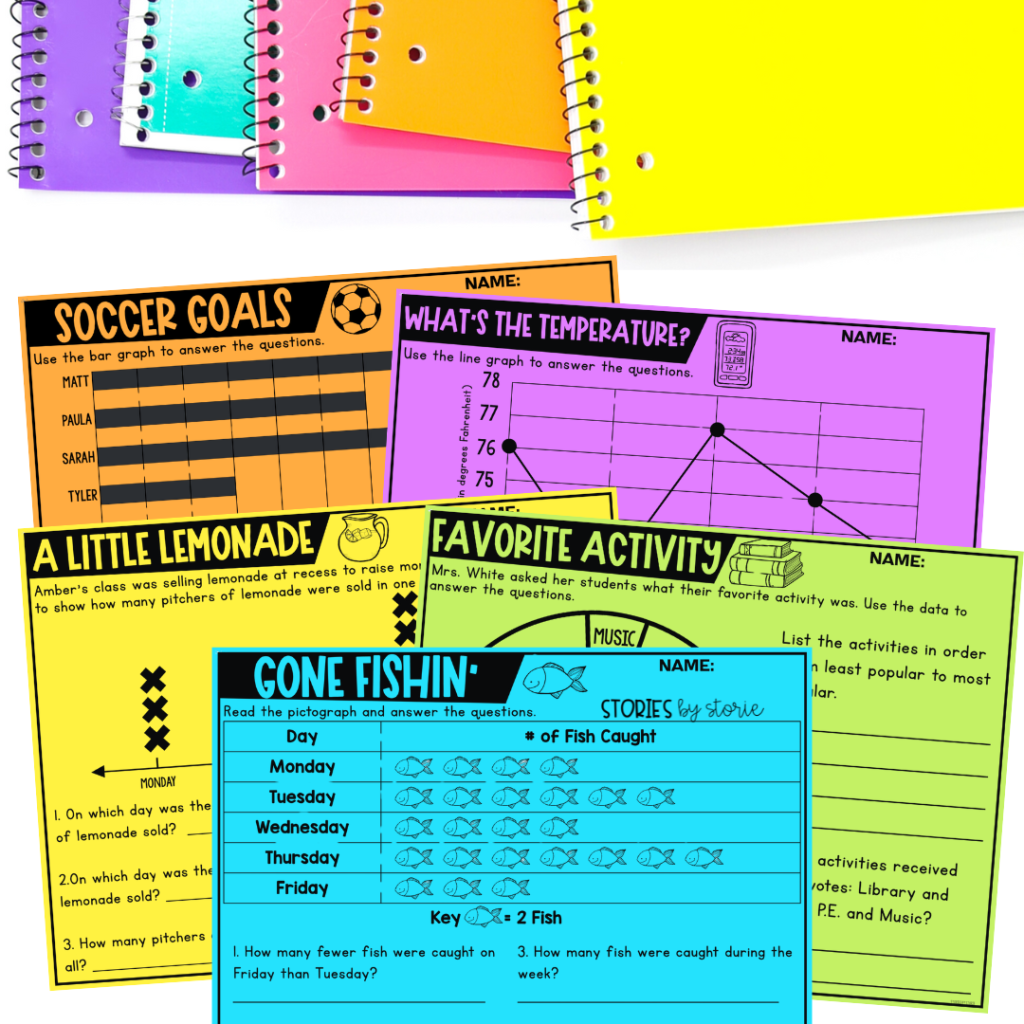
You can also give students a premade set of data. They can count, tally, and graph the information before answering a few questions about the data.
Fun with Food
Integrating food into your math lesson is one way to boost engagement, increase motivation, and provide a multi-sensory approach to learning. There are so many foods out there that lend themselves to graphing because they can be sorted by their colors and shapes. Here are some of my favorite foods that work well for graphing practice and are easy to find (or have donated by families):
- jelly beans
- Lucky Charms marshmallows
- Skittles
- candy hearts
- Fruit Loops
- M&Ms
After the graphing is complete, students can eat the food they touched. Note: be sure to check for food allergies before trying this activity.
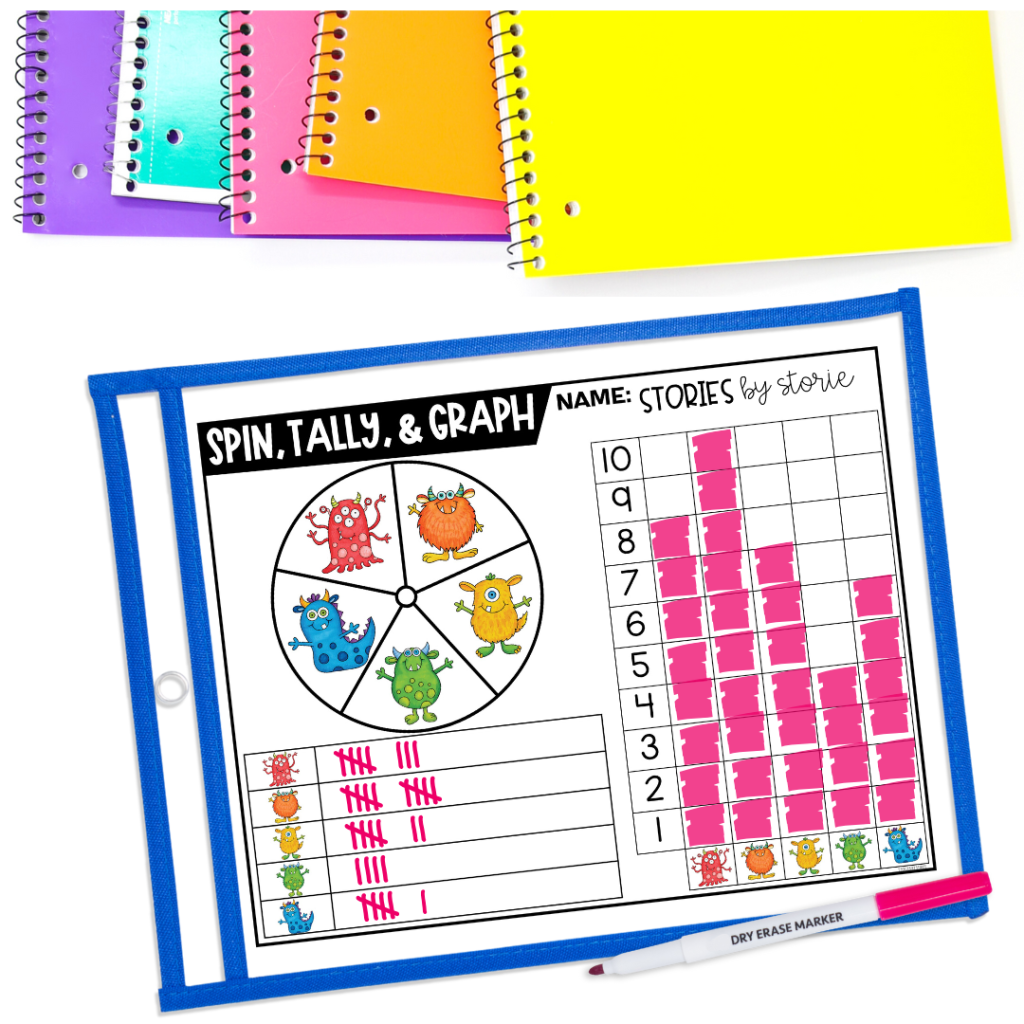
Spin, Tally, and Graph
Another way to add instant engagement is to use spinners. Students spin, tally, and graph the results until one category reaches the top of the graph. To save on copies, place the page in a dry erase pocket or sheet protector and students can use the page over and over again with different results.
Build Critical Thinking
Getting students to ask and answer questions about a graph is an important part of critical thinking. The right set of questions encourages students to read and interpret data more effectively to gain a deeper understanding which allows them to analyze data and draw conclusions.
So what types of questions should we be asking or encouraging students to ask? Here are a few to get you started:
- What does this graph show?
- What type of graph is this?
- What information does the x-axis/y-axis provide?
- How many votes in all?
- Which ___ had the most/least votes?
- How many more/fewer votes did ____ get than ____?
- How many more votes would ____ need to have more votes than ____?
- How many people voted for ____ and ____?
- What is the difference between the highest and lowest value on this graph?
- Are there any categories with the same number of votes?
- How does this graph compare to another graph we’ve studied?
- How could this data be used in real life?
- Who might collect this data and what would they do with the information?
- How could the data change if we added more categories? Which categories would you add?
- Do you think this graph accurately represents the data and why?
Get Physical
I think we can all agree that kids need opportunities throughout their day to move. Movement allows kids to release excess energy, which helps improve their focus and concentration. Here are some graphing ideas that encourage movement:
- One Minute Timer – set a timer and see how many times students can complete an activity (stand up/sit down, jumping jacks, hop on one foot, clap hands, etc.) and then graph the results
- Nature Walk – take students outside where they can identify trees, collect leaves, count outside doors/windows, etc. and graph the results
- Game Time – students can shoot hoops 10 times, kick a soccer ball into a goal 10 times, toss 10 bean bags into a hula hoop, etc. and then graph their results
- Human Graph – place a piece of tape along the floor as the x-axis. Use sticky notes to mark the numbers or categories below the line. Students will answer the question being asked by moving their body into position and create a human graph. After, you can have students graph the results on paper.
Incorporate Graphing into Your Daily Routine
You don’t have to wait for the graphing lessons in your curriculum to get started. In fact, there are several ways you can incorporate graphing into your daily routine all year long.
Here are some graphs you might try:
- weather
- lunch count & attendance
- transportation to and from school
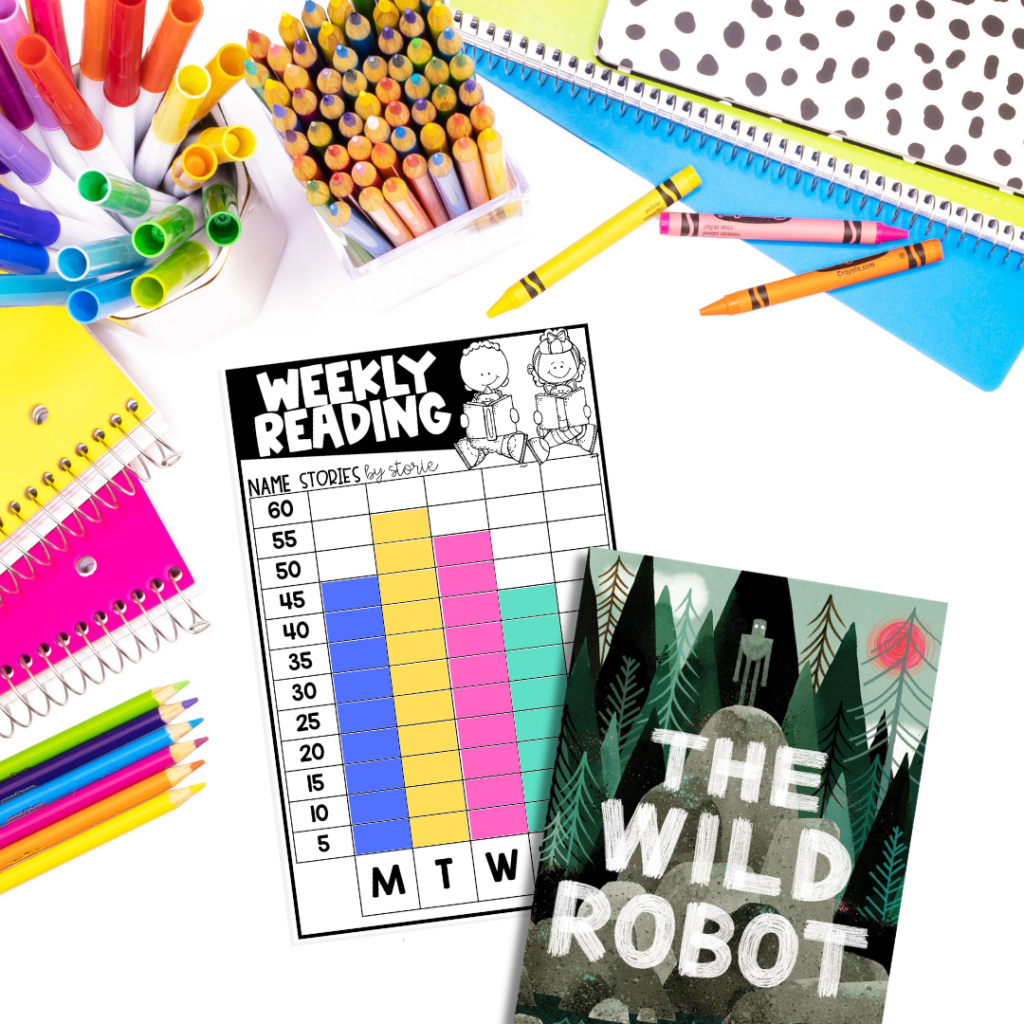
- books or minutes read each day
- math facts mastered
- days in school
- birthdays
Additionally, start making a habit of pointing out graphs you see during the day. These might show up in your textbook, in the hallways around the school, in a video you watch, in the local newspaper, on nutrition labels, etc. Encourage students to look for graphs in their homes and bring them in to share with the class.
Ways to Assess Learning
After you finish your graphing unit, it’s important to assess students. You can give a more traditional, paper and pencil quiz or test. These often ask students to either read and interpret information from a graph OR to create a graph from a set of provided data.
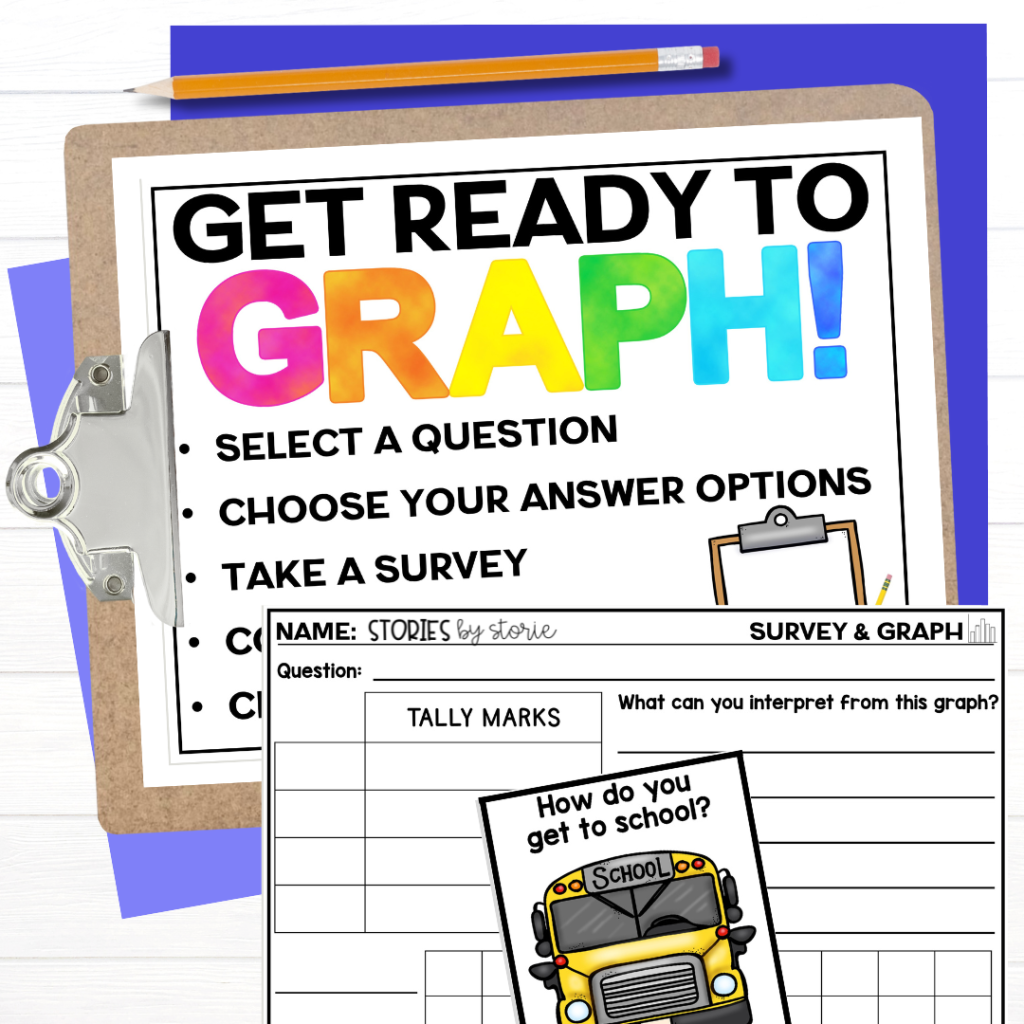
Another idea is to have students conduct their own survey of the class and select an appropriate graph for displaying the data. Once all students have finished, create a Graphing Gallery so everyone can see their hard work.
If you’re looking for a collaborative project, place students into groups. Provide each group with a survey question or a pre-made set of data. The students work together to collect and/or analyze the data, select a graph, and work together to display the data. Students can present their project to the class.
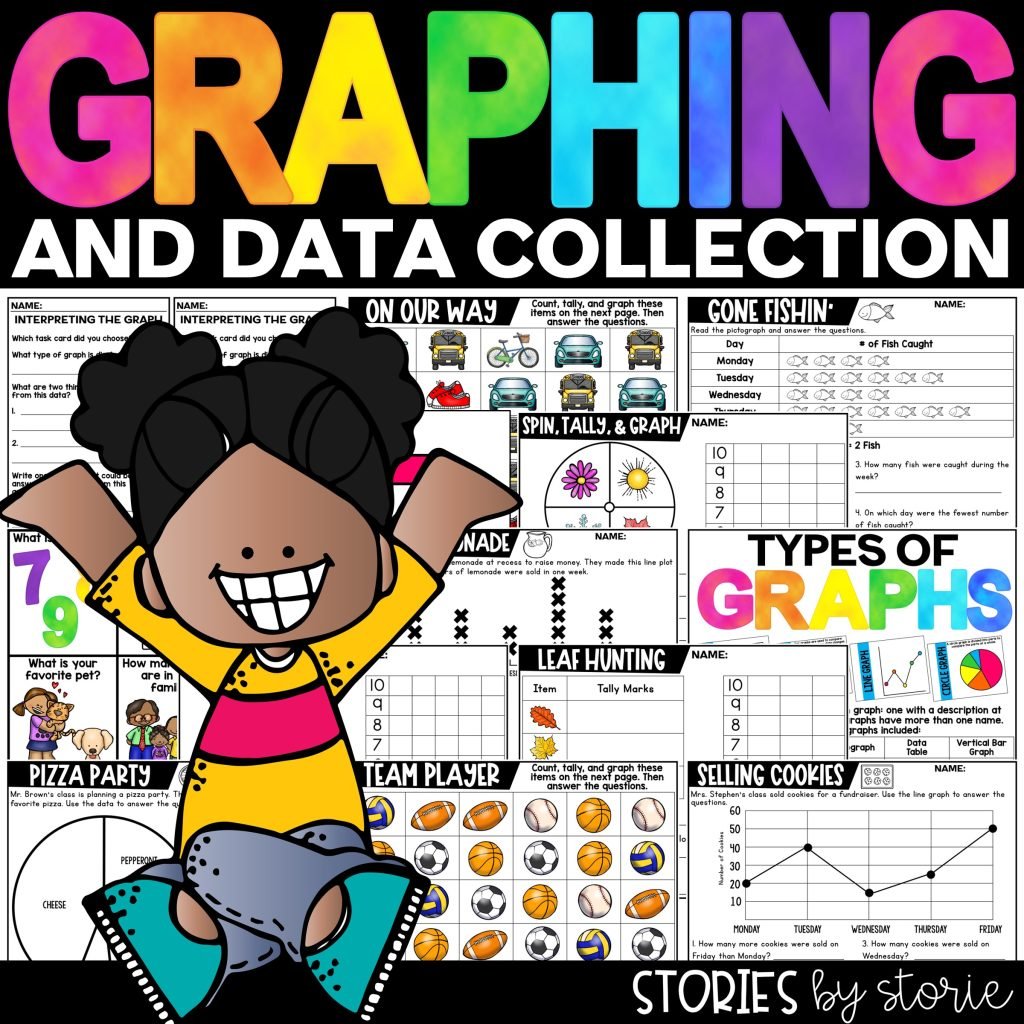
Many of the activities mentioned above can be found in this Graphing and Data Collection pack. There are printable and digital options included.
What are your favorite ways to practice graphing?
You might also like:
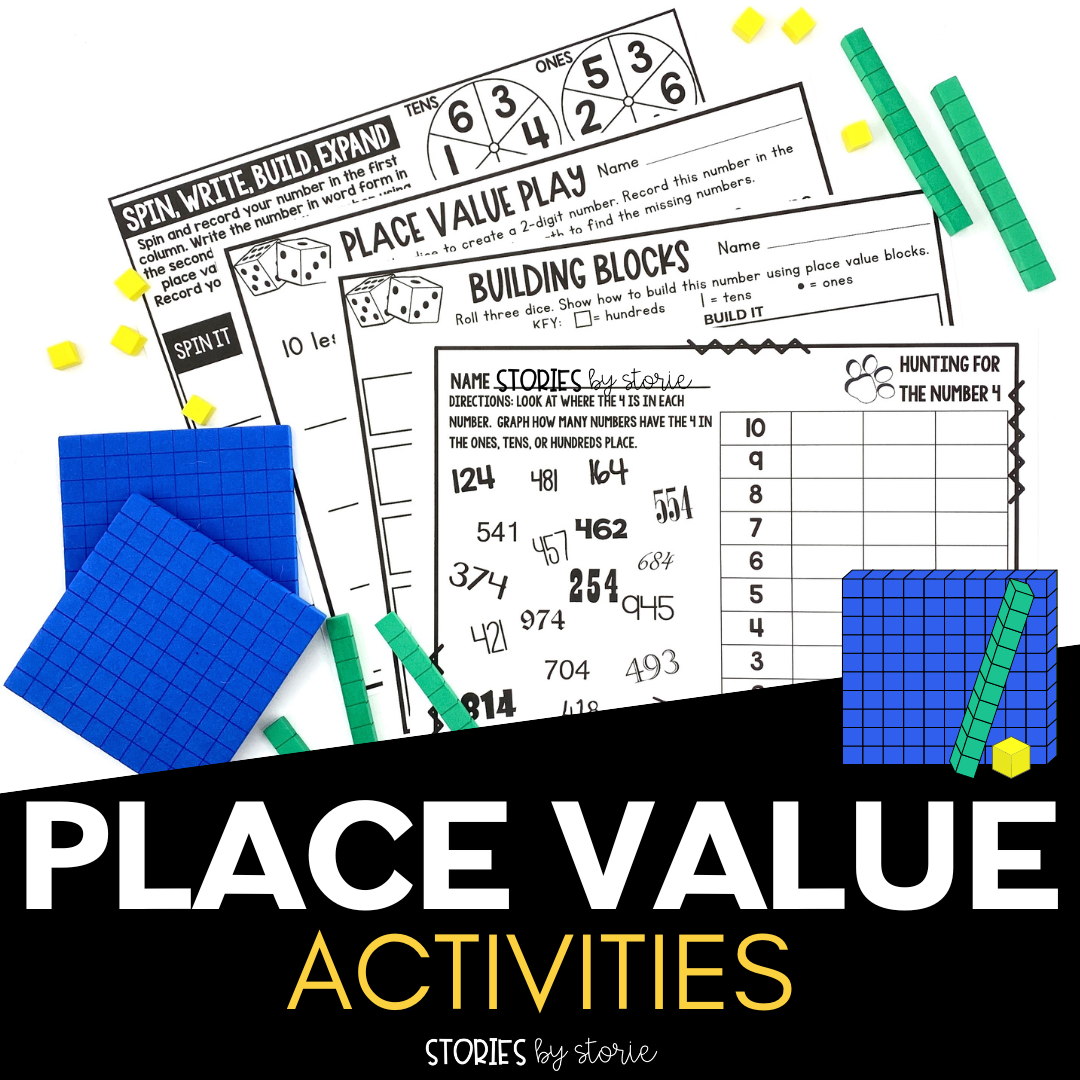
- Place Value Activities
- Fun Ways to Practice Addition and Subtraction
- Fun Ways to Practice Multiplication
- Fact Family Games and Activities
- Telling Time Games and Activities
- Counting Coins Games and Activities
Happy Teaching!